

Let’s see in details what is the Pearson formula, or linear correlation coefficient, and how to code it in Python without any library !
In mathematics, the correlation between several variables implies that these variables are dependent on each other.
Hence, linear correlation implies that two variables have a linear relationship between them. If there is a linear correlation, then the relationship between these variables can be represented by a straight line.
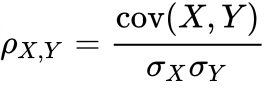
To calculate this linear correlation coefficient, we use the Pearson formula which is the calculation of the covariance between the variables, divided by the product of their standard deviations.
Thus, if we want to calculate the linear correlation between two variables we use :
The higher the absolute value of the linear correlation coefficient, the more the two variables are linearly correlated (i.e. the more the relationship can be represented by a line).
However, a zero coefficient does not imply independence, because other types of (non-linear) correlation are possible.
This formula is discussed in the exercise on the HackerRank website for Statistics & Machine Learning : Correlation and Regression Lines – A Quick Recap #1
Pearson formula
First we have our two variables, two lists of integers :
By the way, if your goal is to master Deep Learning - I've prepared the Action plan to Master Neural networks. for you.
7 days of free advice from an Artificial Intelligence engineer to learn how to master neural networks from scratch:
- Plan your training
- Structure your projects
- Develop your Artificial Intelligence algorithms
I have based this program on scientific facts, on approaches proven by researchers, but also on my own techniques, which I have devised as I have gained experience in the field of Deep Learning.
To access it, click here :
Now we can get back to what I was talking about earlier.
x = [15, 12, 8, 8, 7, 7, 7, 6, 5, 3]
y = [10, 25, 17, 11, 13, 17, 20, 13, 9, 15]
We calculate the average of these variables…
mX = sum(x)/len(x)
mY = sum(y)/len(y)
… and then calculate the covariance :
cov = sum((a - mX) * (b - mY) for (a,b) in zip(x,y)) / len(x)Then we compute the standard deviation of each of the variables:
stdevX = (sum((a - mX)**2 for a in x)/len(x))**0.5
stdevY = (sum((b - mY)**2 for b in y)/len(y))**0.5
Afterwards, we can calculate the linear correlation coefficient thanks to Pearson’s formula !
(We have intentionally rounded the result to three digits after the decimal point)
result = round(cov/(stdevX*stdevY),3)Finally, we display the result :
print(result)We get 0.145, this implies that the two variables are not really linearly correlated !
sources :
- Wikipedia
- Photo by Everton Vila on Unsplash
One last word, if you want to go further and learn about Deep Learning - I've prepared for you the Action plan to Master Neural networks. for you.
7 days of free advice from an Artificial Intelligence engineer to learn how to master neural networks from scratch:
- Plan your training
- Structure your projects
- Develop your Artificial Intelligence algorithms
I have based this program on scientific facts, on approaches proven by researchers, but also on my own techniques, which I have devised as I have gained experience in the field of Deep Learning.
To access it, click here :