The 13 essential Data Science libraries you need to know to analyze data and understand your dataset.
Data Science is the field that brings together manipulation, analysis and understanding of data.
Python is the most used language in this field. But what are the Data Science libraries that you should absolutely know?
That’s what we see in this article !
Pandas – Data Science libraries
No need to introduce it anymore !
The Pandas library is the basis for any Data Scientist.
It allows you to easily manipulate data. To extract them from an excel, csv, txt file, and even from a web page !
But also to do operations between columns, rows and cells of a DataFrame.
It is ideal for working with any type of data: integer, float, text, date, etc.
To use it :
pip install pandasimport pandas as pdNumpy – Data Science libraries
Numpy allows to work easily with Array.
It is easy to perform complex mathematical operations thanks to its set of functions.
In addition to that, its low computation time enables you to execute your code rapidly.
To use it :
pip install numpyimport numpy as npScipy – Data Science libraries
Scipy is an extension of Numpy.
It allows you to push the calculations even further, in particular to do :
- optimization
- statistics
- signal processing
- linear algebra
To use it :
pip install scipyimport scipyMatplotlib – Data Science libraries
Want to display graphics without the headache?
Matplotlib is the library you need !
It allows you to make simple but powerful graphics. Whether it is via Pandas DataFrame or Numpy Array.
With Matplotlib you can make :
- continuous interval graphs
- discontinuous interval graphs
- scatter plots
- Tukey boxes
- bar charts
- pie charts
- 3D volumes
- heatmap
- time series visualizations
… and many more! I let you explore the documentation to see the extent of Matplotlib.
To use it :
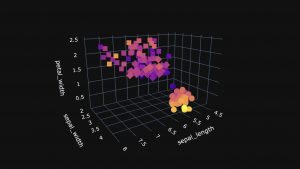
pip install matplotlibimport matplotlib.pyplot as pltSeaborn – Data Science libraries
As Scipy is an extension of Numpy, Seaborn is an extension of Matplotlib
Its major contribution ?
A more pleasant use of Matlpotlib. Seaborn has pre-implemented functions allowing to draw stylized graphics in a single line of code.
Example in image :
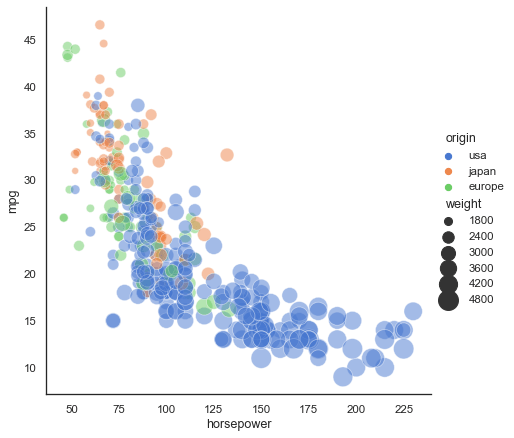
And the line of code the three lines of code to reproduce the example :
import seaborn as sns
sns.set_theme(style="white")
# Load the example mpg dataset
mpg = sns.load_dataset("mpg")
# Plot miles per gallon against horsepower with other semantics
sns.relplot(x="horsepower", y="mpg", hue="origin", size="weight",
            sizes=(40, 400), alpha=.5, palette="muted",
            height=6, data=mpg)
To use it :
pip install seabornimport seaborn as snsPlotly – Data Science libraries
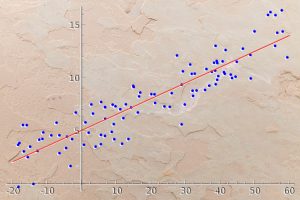
Plotly is a more advanced library than matplotlib for data visualization.
The developers of the library claim to be able to make “publication-quality graphs”, i.e. professional quality graphs especially for scientific publications.
Personally, I like the fact of having interactive graphics with Plotly in which you can zoom and navigate easily. But for simple analysis graphs, you can stick with Matplotlib.
To use it:
pip install plotlyimport plotly.express as pxStatsmodels – Data Science libraries
Statsmodels is a Python library for statistics, estimation and data mining.
By the way, if your goal is to master Deep Learning - I've prepared the Action plan to Master Neural networks. for you.
7 days of free advice from an Artificial Intelligence engineer to learn how to master neural networks from scratch:
- Plan your training
- Structure your projects
- Develop your Artificial Intelligence algorithms
I have based this program on scientific facts, on approaches proven by researchers, but also on my own techniques, which I have devised as I have gained experience in the field of Deep Learning.
To access it, click here :
Now we can get back to what I was talking about earlier.
You have at your disposal several models to better understand your data. Thus you can do linear regression, time series analysis or implement Generalized Additive Models (GAM).
To use it:
pip install statsmodelsimport statsmodels.api as smScikit-learn
Scikit-learn is THE most used library in Data Science to do Machine Learning.
It allows you to do Machine Learning in a simple way by providing you with ready-to-use algorithms !
This makes it an essential base for Data Science but also a good entry point to Machine Learning.
To use it :
pip install scikit-learnimport scikit-learn as sklearnNLTK – Data Science libraries
NLTK is the leader in natural language processing.
This library offers functions for a wide variety of operations :
- tokenization
- lemmatization
- stemmatization
- entity and proper name detection
- stopwords removal
- sentiment analysis (and intensity)
The list is too long to be exhaustive but you can see our other articles in the NLP category !
To use it :
pip install nltkimport nltkGensim – Data Science libraries
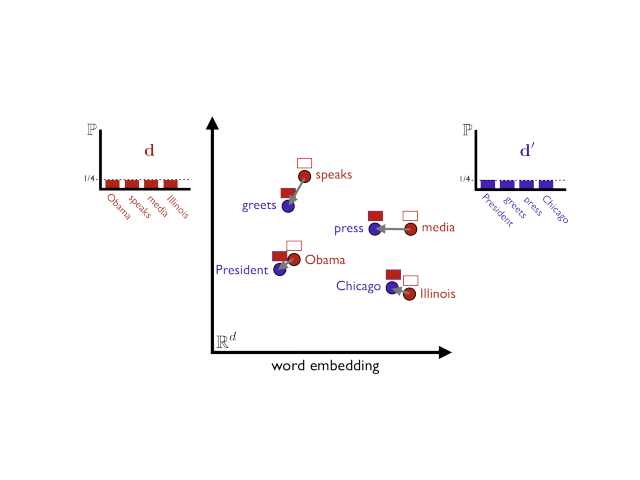
Gensim is used to do a very specific NLP task : vector representation.
Indeed, with Gensim you can represent text as a vector. And it works for any kind of text, be it a scientific document, a book or a press article !
Once a text is represented as a vector, there are a lot of nice analysis to do. For example, you can calculate the similarity between two texts, even if they have no words in common :
To use it :
pip install gensimimport gensimSpacy – Data Science libraries
Spacy is the last NLP library of this top.
It shares most of the features of NLTK but here the library specializes in production applications.
One will use Spacy to integrate text analysis tools in web apps rather than for pure analysis in Python.
Note that Spacy is particularly effective in understanding long and detailed text.
To use it :
pip install spacyimport spacyBeautifulSoup – Data Science libraries
BeautifulSoup is a library for extracting data from HTML files.
Put simply, BeautifulSoup allows you to retrieve data from other websites. This technique is called Web Scraping.
In addition, this library offers a simple way to navigate through this HTML file. For instance to display titles, we’ll use file.title.
And for those who are less familiar with HTML, a function is proposed to convert HTML into text. Ideal if you want to use NLP !
To use it :
pip install beautifulsoup4from bs4 import BeautifulSoupNetworkX – Data Science libraries
NetworkX is a niche library. Only a part of the Data Scientists need it.
It is a library that offers a class to manipulate Graphs and all kind of functions associated to this objects.
Graphs are particularly useful objects to represent relationships between individuals (people, companies, …).
Be careful here we are not talking about a graph but about a Graph.
To use it :
pip install networkximport networkx as nxData Science is an essential foundation for creating Machine Learning algorithms.
But today, it’s thanks to Deep Learning that tech leaders can create the most powerful Artificial Intelligences.
If you want to deepen your knowledge in the field, you can access my Action plan to Master Neural networks.
A program of 7 free courses that I’ve prepared to guide you on your journey to learn Deep Learning.
If you’re interested, click here:
One last word, if you want to go further and learn about Deep Learning - I've prepared for you the Action plan to Master Neural networks. for you.
7 days of free advice from an Artificial Intelligence engineer to learn how to master neural networks from scratch:
- Plan your training
- Structure your projects
- Develop your Artificial Intelligence algorithms
I have based this program on scientific facts, on approaches proven by researchers, but also on my own techniques, which I have devised as I have gained experience in the field of Deep Learning.
To access it, click here :


Can you explain the difference between Matplotlib and Seaborn in terms of data visualization capabilities and ease of use, and when would you choose one over the other for creating graphs in Python?