

Recall, Precision, F1 Score how to easily remember their usefulness and what these metrics imply ?
To understand these metrics, you need to know the concepts of True Positive / False Negative (detailed in this article along with a method to not confuse them).
From these concepts, we will deduce metrics that will allow us to better analyze the performance of our Machine Learning model !
Recall
Recall gives us the percentage of positives well predicted by our model.
In other words, it is the number of well predicted positives (True Positive) divided by the total number of positives (True Positive + False Negative).
In mathematical terms, it gives us :
But what is the point of recall?
The higher it is, the more the Machine Learning model maximizes the number of True Positives.
But be careful, this does not mean that the model isn’t wrong.
When the recall is high, it rather means that it will not miss any positive. Nevertheless it doesn’t give any information about its prediction quality on the negatives.

Precision
Precision is quite similar to recall, so it is important to understand the difference.
It shows the number of positive predictions well made.
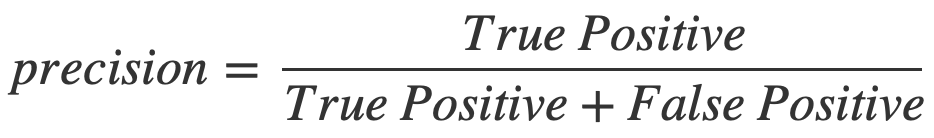
In other words, it is the number of well predicted positives (True Positive) divided by all the positives predicted (True Positive + False Positive).
This gives us in mathematical terms :
What is the benefit of precision ?
The higher it is, the more the Machine Learning model minimizes the number of False Positives.
When the precision is high, it means that the majority of the positive predictions of the model are well predicted positives.

A concrete example to better understand
Let’s go back to our example from the article on True Positives and False Negatives.
We are in front of a tunnel and we have to predict whether a car (Positive) or a motorcycle (Negative) will come out.
Well, recall is the number of cars that our model predicted, and that turned out to be cars, divided by the total number of cars that went through the tunnel.
By the way, if your goal is to master Deep Learning - I've prepared the Action plan to Master Neural networks. for you.
7 days of free advice from an Artificial Intelligence engineer to learn how to master neural networks from scratch:
- Plan your training
- Structure your projects
- Develop your Artificial Intelligence algorithms
I have based this program on scientific facts, on approaches proven by researchers, but also on my own techniques, which I have devised as I have gained experience in the field of Deep Learning.
To access it, click here :
Now we can get back to what I was talking about earlier.
Precision is also the number of cars that our model predicted, and that turned out to be cars, but in this case, divided by the total number of cars that our model predicted, and that turned out to be true (car) or false (motorcycle).
In fact with the recall, we look at the number of positives that the model has predicted well on all the positives.
Whereas with precision, we look at the number of positives that the model has predicted on the set of positives predicted.
How to remember ?
In one sentence :
- The higher the recall, the more positives the model finds
- The higher the precision, the less the model is wrong on the positives

F1 Score
Although useful, neither precision nor recall can fully evaluate a Machine Learning model.
Separately these two metrics are useless :
- if the model always predicts “positive”, recall will be high
- on the contrary, if the model never predicts “positive”, the precision will be high
We will therefore have metrics that indicate that our model is efficient when it is, on the contrary, more naive than intelligent.
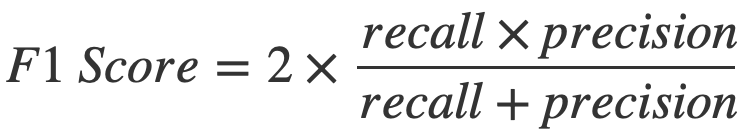
Fortunately for us, a metric exists to combine precision and recall : F1 Score.
The F1 Score provides a good evaluation of the performance of our model.
It is calculated as follows :
So why calculate F1 Score and not just the average of the two metrics ?
In fact, in statistics, the calculation on percentages is not exactly the same as on integers.
Here the F1 Score is what we call the harmonic mean. It is another type of average than the usual one and it is an excellent way to calculate the average of rate or percentage (here recall and precision).
This makes the F1 Score one of the most used metrics among Data Scientists !
As you might have understood, the higher your F1 Score, the better your model will perform.
That’s it for this article on Machine Learning metrics, I hope it was useful for you 😀
sources :
- L. Antiga, Deep Learning with PyTorch (2020, Manning Publications) – our affiliated link
- Photo by Jonathan Körner on Unsplash
One last word, if you want to go further and learn about Deep Learning - I've prepared for you the Action plan to Master Neural networks. for you.
7 days of free advice from an Artificial Intelligence engineer to learn how to master neural networks from scratch:
- Plan your training
- Structure your projects
- Develop your Artificial Intelligence algorithms
I have based this program on scientific facts, on approaches proven by researchers, but also on my own techniques, which I have devised as I have gained experience in the field of Deep Learning.
To access it, click here :