In this article, I give you my complete function to draw bounding boxes easily in Python with OpenCV, adaptable for COCO dataset.
As a Python developer, it’s not always easy to keep in mind all the existing functions.
And sometimes analysing the debates on StackOverflow to find THE right answer can be a waste of time more than anything else.
That’s why in this article I propose you a function that WORKS to display Bounding Boxes on an image with label AND score.
The function to make Bounding Boxes
The function can be broken down into two parts.
First, we want to be able to easily display a bounding box on an image.
On top of that, we want to display the label of the detected object.
Here is the function that allows you to do this:
def box_label(image, box, label='', color=(128, 128, 128), txt_color=(255, 255, 255)):
  lw = max(round(sum(image.shape) / 2 * 0.003), 2)
  p1, p2 = (int(box[0]), int(box[1])), (int(box[2]), int(box[3]))
  cv2.rectangle(image, p1, p2, color, thickness=lw, lineType=cv2.LINE_AA)
  if label:
    tf = max(lw - 1, 1)  # font thickness
    w, h = cv2.getTextSize(label, 0, fontScale=lw / 3, thickness=tf)[0]  # text width, height
    outside = p1[1] - h >= 3
    p2 = p1[0] + w, p1[1] - h - 3 if outside else p1[1] + h + 3
    cv2.rectangle(image, p1, p2, color, -1, cv2.LINE_AA)  # filled
    cv2.putText(image,
                label, (p1[0], p1[1] - 2 if outside else p1[1] + h + 2),
                0,
                lw / 3,
                txt_color,
                thickness=tf,
                lineType=cv2.LINE_AA)
Next, we need a function that displays the image and all the bounding boxes we want to see.
To do this we will loop through the list of BB and call box_label() on each one.
In addition to this, the function supports several cases.
For example, by default, the function displays the label of each object AND the detection score, but you can display only the label if you wish.
If you are on Google Colab, the function detects it and adapts its code to display the image on your screen.
Here are the attributes of the function:
By the way, if your goal is to master Deep Learning - I've prepared the Action plan to Master Neural networks. for you.
7 days of free advice from an Artificial Intelligence engineer to learn how to master neural networks from scratch:
- Plan your training
- Structure your projects
- Develop your Artificial Intelligence algorithms
I have based this program on scientific facts, on approaches proven by researchers, but also on my own techniques, which I have devised as I have gained experience in the field of Deep Learning.
To access it, click here :
Now we can get back to what I was talking about earlier.
image– your image inarray numpyformatboxes– your list of Bounding Boxes in the format[x1, y1, x2, y2, score, label]– if the score is not present indicatescore=Falselabels– the labels are by default aligned with those of the COCO dataset, otherwise you can indicate your owncolors– the colours corresponding to the labelsscore– ifTrue, displays the scoreconf– the minimum confidence threshold (thescore) required to display a bounding box
def plot_bboxes(image, boxes, labels=[], colors=[], score=True, conf=None):
  #Define COCO Labels
  if labels == []:
    labels = {0: u'__background__', 1: u'person', 2: u'bicycle',3: u'car', 4: u'motorcycle', 5: u'airplane', 6: u'bus', 7: u'train', 8: u'truck', 9: u'boat', 10: u'traffic light', 11: u'fire hydrant', 12: u'stop sign', 13: u'parking meter', 14: u'bench', 15: u'bird', 16: u'cat', 17: u'dog', 18: u'horse', 19: u'sheep', 20: u'cow', 21: u'elephant', 22: u'bear', 23: u'zebra', 24: u'giraffe', 25: u'backpack', 26: u'umbrella', 27: u'handbag', 28: u'tie', 29: u'suitcase', 30: u'frisbee', 31: u'skis', 32: u'snowboard', 33: u'sports ball', 34: u'kite', 35: u'baseball bat', 36: u'baseball glove', 37: u'skateboard', 38: u'surfboard', 39: u'tennis racket', 40: u'bottle', 41: u'wine glass', 42: u'cup', 43: u'fork', 44: u'knife', 45: u'spoon', 46: u'bowl', 47: u'banana', 48: u'apple', 49: u'sandwich', 50: u'orange', 51: u'broccoli', 52: u'carrot', 53: u'hot dog', 54: u'pizza', 55: u'donut', 56: u'cake', 57: u'chair', 58: u'couch', 59: u'potted plant', 60: u'bed', 61: u'dining table', 62: u'toilet', 63: u'tv', 64: u'laptop', 65: u'mouse', 66: u'remote', 67: u'keyboard', 68: u'cell phone', 69: u'microwave', 70: u'oven', 71: u'toaster', 72: u'sink', 73: u'refrigerator', 74: u'book', 75: u'clock', 76: u'vase', 77: u'scissors', 78: u'teddy bear', 79: u'hair drier', 80: u'toothbrush'}
  #Define colors
  if colors == []:
    #colors = [(6, 112, 83), (253, 246, 160), (40, 132, 70), (205, 97, 162), (149, 196, 30), (106, 19, 161), (127, 175, 225), (115, 133, 176), (83, 156, 8), (182, 29, 77), (180, 11, 251), (31, 12, 123), (23, 6, 115), (167, 34, 31), (176, 216, 69), (110, 229, 222), (72, 183, 159), (90, 168, 209), (195, 4, 209), (135, 236, 21), (62, 209, 199), (87, 1, 70), (75, 40, 168), (121, 90, 126), (11, 86, 86), (40, 218, 53), (234, 76, 20), (129, 174, 192), (13, 18, 254), (45, 183, 149), (77, 234, 120), (182, 83, 207), (172, 138, 252), (201, 7, 159), (147, 240, 17), (134, 19, 233), (202, 61, 206), (177, 253, 26), (10, 139, 17), (130, 148, 106), (174, 197, 128), (106, 59, 168), (124, 180, 83), (78, 169, 4), (26, 79, 176), (185, 149, 150), (165, 253, 206), (220, 87, 0), (72, 22, 226), (64, 174, 4), (245, 131, 96), (35, 217, 142), (89, 86, 32), (80, 56, 196), (222, 136, 159), (145, 6, 219), (143, 132, 162), (175, 97, 221), (72, 3, 79), (196, 184, 237), (18, 210, 116), (8, 185, 81), (99, 181, 254), (9, 127, 123), (140, 94, 215), (39, 229, 121), (230, 51, 96), (84, 225, 33), (218, 202, 139), (129, 223, 182), (167, 46, 157), (15, 252, 5), (128, 103, 203), (197, 223, 199), (19, 238, 181), (64, 142, 167), (12, 203, 242), (69, 21, 41), (177, 184, 2), (35, 97, 56), (241, 22, 161)]
    colors = [(89, 161, 197),(67, 161, 255),(19, 222, 24),(186, 55, 2),(167, 146, 11),(190, 76, 98),(130, 172, 179),(115, 209, 128),(204, 79, 135),(136, 126, 185),(209, 213, 45),(44, 52, 10),(101, 158, 121),(179, 124, 12),(25, 33, 189),(45, 115, 11),(73, 197, 184),(62, 225, 221),(32, 46, 52),(20, 165, 16),(54, 15, 57),(12, 150, 9),(10, 46, 99),(94, 89, 46),(48, 37, 106),(42, 10, 96),(7, 164, 128),(98, 213, 120),(40, 5, 219),(54, 25, 150),(251, 74, 172),(0, 236, 196),(21, 104, 190),(226, 74, 232),(120, 67, 25),(191, 106, 197),(8, 15, 134),(21, 2, 1),(142, 63, 109),(133, 148, 146),(187, 77, 253),(155, 22, 122),(218, 130, 77),(164, 102, 79),(43, 152, 125),(185, 124, 151),(95, 159, 238),(128, 89, 85),(228, 6, 60),(6, 41, 210),(11, 1, 133),(30, 96, 58),(230, 136, 109),(126, 45, 174),(164, 63, 165),(32, 111, 29),(232, 40, 70),(55, 31, 198),(148, 211, 129),(10, 186, 211),(181, 201, 94),(55, 35, 92),(129, 140, 233),(70, 250, 116),(61, 209, 152),(216, 21, 138),(100, 0, 176),(3, 42, 70),(151, 13, 44),(216, 102, 88),(125, 216, 93),(171, 236, 47),(253, 127, 103),(205, 137, 244),(193, 137, 224),(36, 152, 214),(17, 50, 238),(154, 165, 67),(114, 129, 60),(119, 24, 48),(73, 8, 110)]

  #plot each boxes
  for box in boxes:
    #add score in label if score=True
    if score :
      label = labels[int(box[-1])+1] + " " + str(round(100 * float(box[-2]),1)) + "%"
    else :
      label = labels[int(box[-1])+1]
    #filter every box under conf threshold if conf threshold setted
    if conf :
      if box[-2] > conf:
        color = colors[int(box[-1])]
        box_label(image, box, label, color)
    else:
      color = colors[int(box[-1])]
      box_label(image, box, label, color)

  #show image
  image = cv2.cvtColor(image, cv2.COLOR_BGR2RGB)

  try:
    import google.colab
    IN_COLAB = True
  except:
    IN_COLAB = False

  if IN_COLAB:
    cv2_imshow(image) #if used in Colab
  else :
    cv2.imshow(image) #if used in Python
Let’s use the function with the YOLOv8 model.
Use the function
To do this, we install the ultralytics library:
!pip install ultralytics &> /dev/nullThen we load the object detection model:
from ultralytics import YOLO
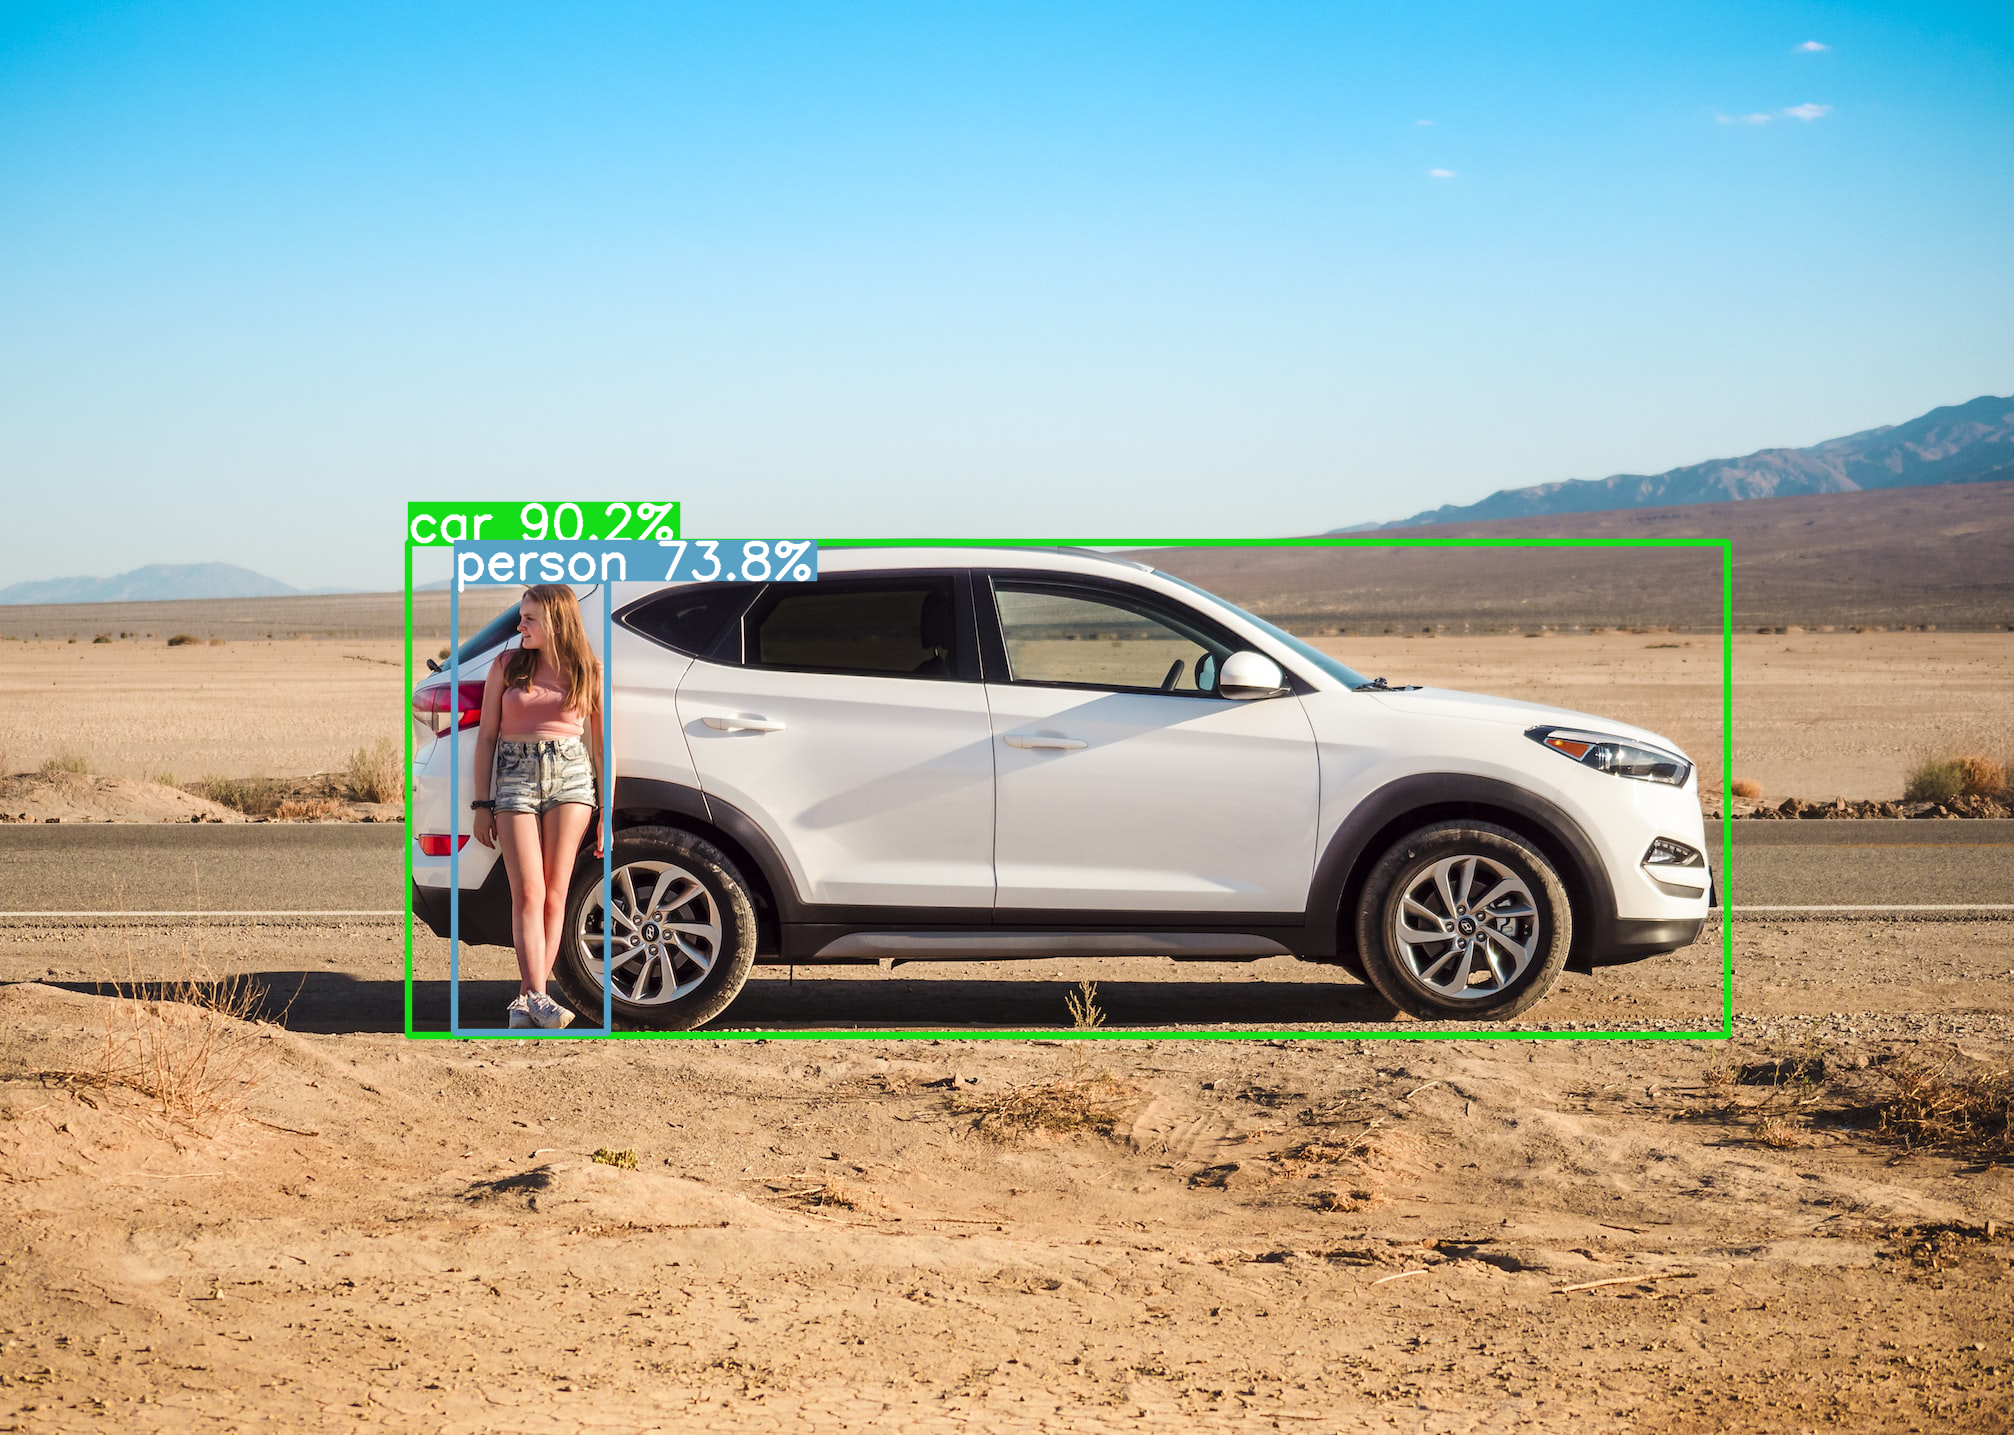
model = YOLO("yolov8n.pt")Then we detect the objects and display the bounding boxes with our plot_bboxes() function and a confidence threshold of 0.8:
import numpy as np
from PIL import Image
import requests
from io import BytesIO
import cv2
from google.colab.patches import cv2_imshow

response = requests.get("https://images.unsplash.com/photo-1635341914750-7f38b76856d8?ixlib=rb-4.0.3&ixid=MnwxMjA3fDB8MHxwaG90by1wYWdlfHx8fGVufDB8fHx8&auto=format&fit=crop&w=1973&q=80")
image = Image.open(BytesIO(response.content))
image = np.asarray(image)

results = model.predict(image)

plot_bboxes(image, results[0].boxes.data, conf=0.8)
And here is the result.
Use the function as you wish!
And if you’d like to go further in mastering Computer Vision – detecting objects on video – analyzing continuous video streams in real time – the following may be of interest to you 😉
I’ve recently created the free Object Detection Off-road training course. Inside, you’ll learn how to use any Deep Learning model on real-time videos and video streams.
To access your free training, click here :
One last word, if you want to go further and learn about Deep Learning - I've prepared for you the Action plan to Master Neural networks. for you.
7 days of free advice from an Artificial Intelligence engineer to learn how to master neural networks from scratch:
- Plan your training
- Structure your projects
- Develop your Artificial Intelligence algorithms
I have based this program on scientific facts, on approaches proven by researchers, but also on my own techniques, which I have devised as I have gained experience in the field of Deep Learning.
To access it, click here :


Thanks for your great tutorial. Could you please write code to visualize only the mask on the image?
Hello Saqib,
Try to use this function instead of the box_label() in the article :
def box_label(image, box, label='', color=(128, 128, 128), txt_color=(255, 255, 255)):

  lw = max(round(sum(image.shape) / 2 * 0.003), 2)

  p1, p2 = (int(box[0]), int(box[1])), (int(box[2]), int(box[3]))

  cv2.rectangle(image, p1, p2, color, thickness=lw, lineType=cv2.LINE_AA)

  if label:

    tf = max(lw - 1, 1)  # font thickness

    w, h = cv2.getTextSize(label, 0, fontScale=lw / 3, thickness=tf)[0]  # text width, height

    outside = p1[1] - h >= 3

    p2 = p1[0] + w, p1[1] - h - 3 if outside else p1[1] + h + 3

    cv2.rectangle(image, p1, p2, color, -1, cv2.LINE_AA)  # filled
I simply removed the part where I use the function
cv2.putText()to put text next to the mask.Then you can use the function
plot_bboxes()as detailed in the article.It should work.
Have a nice day,
Tom
Thanks for the great article! Can I use this to define bounding boxes for OCR?