

Let’s take a close look at what Skewness and Kurtosis are! Two Data Science measures that help you analyze disparity in a dataset.
When doing Data Science, it’s important to know how to analyze the disparity of a dataset.
Disparity is when the data in a dataset is unbalanced.
For example, if you measure the age of people in a children’s playground where there are 20 children and 6 adults. The age of these people will be disparate.
Indeed, the majority of the people are children, say between 4 and 8 years old. And for the adults, there will be two babysitters between 20 and 24 years old, 3 parents between 28 and 35 years old and finally a 60 years old grandmother.
And because a picture is worth a thousand words, here is the dataset graph:
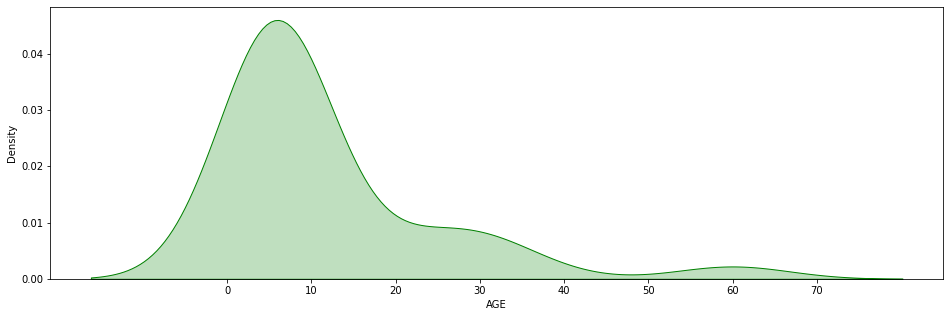
Here we can see that the dataset is disparate. Most of the data are grouped on the left, while single individuals are on the right. We call these solitary data “outliers”, data “out of the norm”.
But then what is the purpose of Skewness and Kurtosis?
Skewness
Above we’ve analyzed the disparity with the naked eye.
On this graph it is quite obvious because I wanted to take an exaggeratedly disparate example. In this case the eye does the job to determine the disparity.
But there are mathematical measures to do this analysis.
Much more precise measures that, when known, give us direct information about our dataset.
The first one is the Skewness.
Skewness computes the symmetry of our dataset.
A dataset is symmetrical when the data are equally distributed on both sides of the average.
When Skewness is equal to 0, the dataset is symmetrical.
But this measure also tells us about the type of skewness.
If the Skewness is greater than 0, then the dataset is skewed to the right. That is, the majority of the data is on the left and the outliers are on the right.
If the Skewness is less than 0, then the dataset is skewed to the left. That is, the majority of the data is on the right and the outliers are on the left.
In our example of the children’s park, the skewness is 2.47.
Indeed we can see on the graph that the dataset is skewed to the right:
Since adults are much older than children, they unbalance the dataset on the right.
Let’s clean up the dataset by removing all the adults.
We obtain this graph:
Here, there is an imbalance. But it is much more difficult to see with the naked eye.
When we calculate the Skewness we get -0.006.
The imbalance is very slight, on the left this time.
It is the precision of the Skewness that allows us to determine this imbalance.
By the way, if your goal is to master Deep Learning - I've prepared the Action plan to Master Neural networks. for you.
7 days of free advice from an Artificial Intelligence engineer to learn how to master neural networks from scratch:
- Plan your training
- Structure your projects
- Develop your Artificial Intelligence algorithms
I have based this program on scientific facts, on approaches proven by researchers, but also on my own techniques, which I have devised as I have gained experience in the field of Deep Learning.
To access it, click here :
Now we can get back to what I was talking about earlier.
In addition to the asymmetry, the Skewness computes the strength of the imbalance. Here -0.006 indicates a very slight imbalance. A value of 1 is a normal imbalance.
Here is the code to calculate the Skewness on a Pandas Dataframe in Python :
df['AGE'].skew()Kurtosis
The Kurtosis also computes the disparity of a dataset. But using another approach.
The Kurtosis computes the tails of our curve.
The tail basically refers to the part of the distribution that is really far away from the mean.
The more there are outlier, the more the tail is heavy.
Be careful not to say that the Kurtosis calculates the flatness of the curve, at the risk of getting your fingers slapped by mathematicians.
But let’s keep in mind that : “The tail of a distribution isn’t a precisely defined term. In other words, there is not some specific place where you stop being in the middle of the distribution and start being in the tail.”
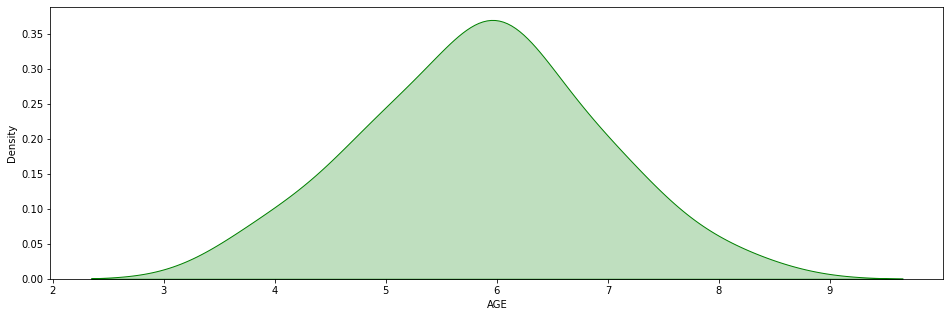
Let’s take the context of a relatively symmetrical dataset like the one in our example:
In our example, the graph is humped and symmetrical. This indicates that there is a clustering of data at the average level.
We also see that our tails seem too be normal. They are neither too thick nor too thin.
How does this translate into Kurtosis ?
Well here, the Kurtosis is -0.03
For a symmetric dataset :
If the Kurtosis is greater than 0, then the dataset is leptokurtic i. e, the tails are thicker than normal. That indicates a cluster of outliers.
If the Kurtosis is less than 0, then the dataset is platykurtic i. e, the tails are thinner than normal. That indicates a negative excess of outliers. In other words, most of the data tend to gather at the mean.
When the Kurtosis is equal to 0, then the dataset is mesokurtic i. e, the tails are the same as in a normal distribution.
Here is the code to calculate the Kurtosis on a Pandas dataframe in Python :
df['AGE'].kurtosis()Disparate dataset = bad dataset ?
In this article, you’ve learned how to calculate the Skewness and Kurtosis.
With these, you will be able to analyze more precisely the disparity of your dataset.
But keep in mind that a disparate dataset is not necessarily a bad dataset!
First and foremost, Skew & Kurtosis are a good indicators to understand your data. The interpretation of this result will depend on the context of your project.
If you are interested in Data Science, you can find all our articles on data analysis and Data Science on this link!
See you soon in a next article 😉
skewness kurtosis
skewness kurtosis
sources :
- Texas A&M University-Commerce – Running Descriptive on SPSS
- Quora – What is the tail of a probability distribution?
One last word, if you want to go further and learn about Deep Learning - I've prepared for you the Action plan to Master Neural networks. for you.
7 days of free advice from an Artificial Intelligence engineer to learn how to master neural networks from scratch:
- Plan your training
- Structure your projects
- Develop your Artificial Intelligence algorithms
I have based this program on scientific facts, on approaches proven by researchers, but also on my own techniques, which I have devised as I have gained experience in the field of Deep Learning.
To access it, click here :


Kurtosis has nothing to do with flatness or peakedness: The beta(.5,1) distribution is infinitely peaked but has low kurtosis. Also, the .9999U(0,1) + .0001Cauchy distribution appears perfectly flat over 99.99% of the observable data, but has infinite kurtosis. Kurtosis only measures tail weight, i.e., propensity of the data generating process to produce occasional extreme values. It measures nothing about the peak.
Hello Peter,
Wow I think it’s a rude manner to bring some knowledge.
As a matter of fact, in French studies, Kurtosis is understood as the flattening of the curve. I quote the French Wikipedia here: “Kurtosis […] also translated as flattening coefficient […] is a direct measure of sharpness and an indirect measure of flatness of the distribution of a real random variable.”
Nevertheless, I changed my article as I guess the American SoTa more accurate than the French one.
For other researchers reading, keep in mind that people don’t intentionally mean to say incorrect things, they just don’t have the same information as you.
Have a good day,
Tom
Having read your posts. I believed you have given your readers valuable information.